 Doug Davidoff
 My daughter is entering her senior year in high school. I have to admit that there are times where I stop and think how I wish I were in high school today. Now, I don’t have this wish for the common reasons you may be thinking.
You see, when I was in high school it wasn’t cool to obsess about things like data. But today, data is about the coolest thing in the world (well, except for maybe AI). Everyone is talking about data. Big data. Little data. Metadata.
Today, it seems, marketing and sales advisors pronounce their coolness by claiming to be data-driven. Everywhere I look, I see people claiming to be data-driven, but when I look at how they manage process and make decisions, it’s no different than how they did things a decade ago.
Sure, they may throw some numbers or vanity metrics at you, but the way they do it reminds me of how I used to describe statistics. Today, data is like a lamp post to a drunk - it’s used more for support than illumination.
Make no mistake. If you want to successfully grow a business today, you’d better be data-driven. I’m fond of Netscape founder Jim Barksdale’s philosophy: If we have data, let’s look at data. If all we have are opinions, let’s go with mine.
So, the first step to be data-driven is to understand what being data-driven means.
The first confusion is that there’s a difference between being goals- or metric-driven and being data-driven. There is probably no clearer illustration of the difference than using my favorite example: baseball.
An Example of Being Goals/Metrics Driven
Being goals/metrics-driven is akin to paying attention to the standings or certain performance targets. For example, it’s common for baseball organizations to break the season into four parts, with a goal/objective to where they want to be at each part of the season (in terms of wins or where they are in the standings). If they’re not where they want to be, they know they need to adjust. The same is true with players paying attention to their stats, as they know bonuses may be reliant on how many home runs they hit.
An Example of Being Data-Driven
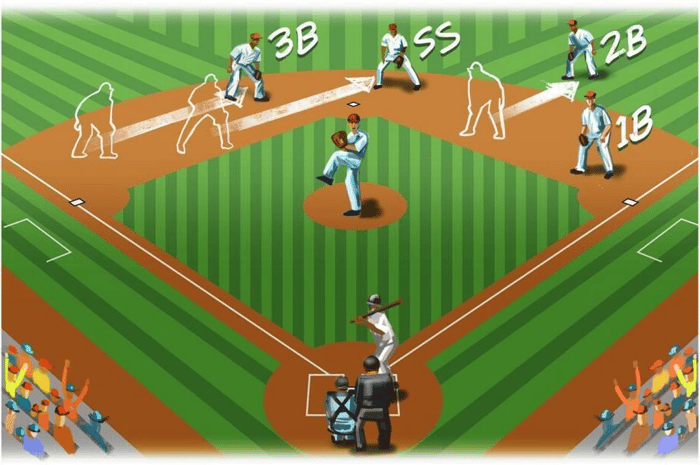
Baseball five--or certainly 10 years ago--versus baseball today is one of the clearest examples of the difference being data-driven can make. Defensive shifts have become extraordinarily common. For those that don’t know what a defensive shift is, here’s a brief explanation: a “non-shifted” defense would have three outfielders, fairly evenly spread across the outfield, and two infielders on each side of second base.
Ten years ago, shifting a defense meant the shortstop edged closer to either second or third base. Today, shifts have increased in frequency and extremes. (I recently saw a shift that literally had all four infielders on the right side of second base.)
MLB Shifts by Season
2011 2012 2013 2014 2015 2016
2,350 4,577 6,882 13,299 17,826 28,130
To viewers and old-time baseball fans, things look strange. People regularly complain (and claim) that this doesn’t work and it’s a bad idea. It’s not unusual to hear someone say, “This is stupid,” anytime a left-handed hitter hits a ball to the left side of the infield, where the shortstop or third-baseman would have been.
How did this happen? Well, a bunch of non-baseball people started really examining the data. Using terabytes of data, they plotted where every play hit a ball on every pitch. This enabled them to pick up clear patterns. Player X predominantly hits ground balls to this area and fly balls in this pattern. With that data, teams moved players to those areas, even though it often looks and feels like it’s the wrong thing to do. What impact does this have?
In the last decade, the batting average of major league players has dropped 20 points.
Data doesn’t stop on the defensive side in baseball. Fans often question why hitters don’t just bunt the ball down the third base line when facing the shift. There are two good reasons for this:
- It’s much easier said than done.
- The data shows it’s the wrong thing to do.
Remember, if your goal is to win baseball games, your goal isn’t to get someone on first base; it’s to score the most runs you can in the 27 outs you’re “budgeted.” The data shows that if you’re “solving for runs,” the team is still more likely to score more runs if the batter attempts to get a hit, even though he’s less likely to get one. (For those wondering why this is, hit me up on Twitter and I’ll send you the explanation.)
You’ll also see that this data-driven approach is changing how players hit. Increased attention and effort is spent on adjusting the launch angle and spin of the ball when it comes off the bat. Why? Because the data demonstrates it increases the probability of better outcomes.
This is one of the primary reasons that even though batting averages are down from where they were 10 years ago, average runs scored are not.
Moneyball: The Ultimate Data-Driven Approach
Anyone who knows me knows what a big fan of Moneyball (here’s more on the backstory of Moneyball if you’re interested). The Oakland A’s were at a competitive disadvantage and needed to find a way to not only compete, but to win. They turned to data and changed the way the entire professional sports world competes.
Being data-driven is about embracing the scientific method. It’s taking an advanced approach to problem-solving. I often think of noted physicist Richard Feynman when talking about what it means to be data-driven. Students should be made to think like scientists, be open-minded, curious, and especially doubt.
Are You Deterministic or Probabilistic?
Humans are horrible at predicting the future. They also suck at identifying what works and what doesn’t. There are two core reasons for this:
- Far too few people know what the difference between correlation, coincidence, and causation is. (Here’s a primer if you’re curious.)
- People typically approach life with a deterministic approach.
To be deterministic is to believe there’s a single answer/solution/outcome to every question, experiment or effort. When you’re deterministic, everything is black or white, good or bad, right or wrong, successful or not.
The problem (especially as it relates to running/growing a business, implementing a sales and marketing effort, or a running a demand generation initiative) is that we live in a highly dynamic, complex system and the results of our actions take days, weeks, months or even years to fully assess.
Being data-driven requires that you take a probabilistic approach to decision-making. You’re not seeking a single outcome or the “right” decision. Rather you’re working to increase the likelihood that you get the outcome you want.
Remember that if running a business worked with a deterministic approach, there would be virtually no risk (which sounds great), but the potential returns would be pretty close to what you’d get if you put your money in an FDIC-insured savings account.
A Process to be Data-Driven
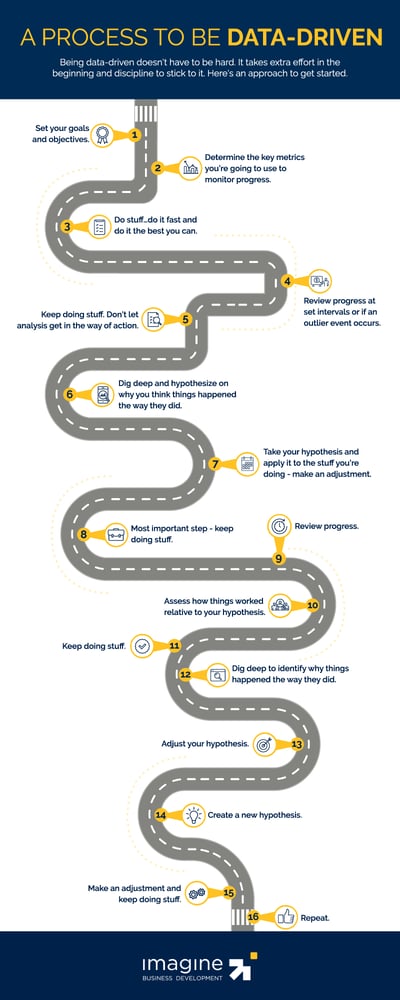 Being data-driven doesn’t have to be hard. It takes some extra effort in the beginning, along with the discipline to stick to it. Here’s an approach to get started:
- Set your goals and objectives.
- Determine the key metrics you’re going to use to monitor progress. This is probably the toughest part of the entire process and you should be constantly assessing if you’re using the right metrics. If your metrics are bad, you won’t get the benefit of being data-driven.
- Do stuff…do it fast and do it the best you can.
- Review progress at set intervals or if an outlier event occurs
- Keep doing stuff. Don’t let analysis get in the way of action.
- Dig deep and hypothesize on why you think things happened the way they did - we call this a hypothesis.
- Take your hypothesis and apply it to the stuff you’re doing - make an adjustment.
- Here’s the most important step - keep doing stuff. (Ideally, apply the hypothesis you’ve developed, but regardless, keep doing stuff.)
- Review progress.
- Assess how things worked relative to your hypothesis.
- Keep doing stuff
- Dig deep to identify why things happened the way they did.
- Adjust your hypothesis.
- Create a new hypothesis.
- Make an adjustment and keep doing stuff.
- Repeat
As you apply this approach more and do it longer, you’ll find it becomes natural and you get much better at it. You’ll find yourself taking this approach to every decision you make, without even having to think about it.
More importantly, the world will become less of a mystery. Your business will become more predictable and you’ll be able to take bigger steps with less effort.