 In my role at Imagine Business Development, I am responsible for publishing posts to our blog and also promoting each post through social media. At least once a week, I am surprised by the engagement one post receives over another either through social media or our email campaigns.
I have spent significant time trying to figure out why this happens. Sometimes it is very obvious. Let's face it...all posts are not created equal. However, sometimes the posts (either blog or social media) that have a great headline, clear, concise message and follow all of the best practices to the letter, do no gain traction and those that are just ok, do.
Optimizing anything when it comes to inbound marketing is an ongoing effort. To help identify where I can make improvements, I’ve been doing some research. I made a list of things that could possibly be effecting why some posts perform better than others. One of the most basic things to evaluate is timing. Could the day of the week and time of day be having an impact on my posts? I decided to dig deeper and was able to find a report from TrackMaven that analyzed several content related items.
The report, called the Colossal Content Marketing Report, analyzed 4,618 blogs with 1,167,426 individual posts. For the purposes of their report, engagement or effectiveness of a blog post is measured by the number of social shares. This is of great interest to me because a goal I have for myself in 2015 is to increase the number of social shares our blog posts receive.
Schedule
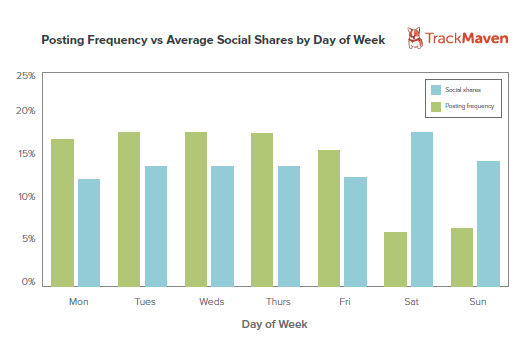
The first item the report covers is schedule. The data gathered shows that, not surprisingly, most blog posts are published during the workweek. In fact, 87% of the nearly 1.2 million posts analyzed were published during the workweek. The most popular days are Tuesday and Wednesday followed closely by Thursday.
What’s interesting is that the 13% of posts that were published on the weekend received the most social shares. Only 6.3% of the 1.2 million posts analyzed were published on a Saturday but they received 18% of the total social shares. See for yourself in the chart below.
Until reading this report, I probably would not have considered publishing a blog post on a Saturday. But now, I think it worth testing.
The next item covered in the report is the best time of day to post. As you can see on the graphs below, the most popular times to post are during regular business hours, 9am-5pm EST. But as the bottom graph shows, posting during regular business hours doesn’t bring the most social shares.
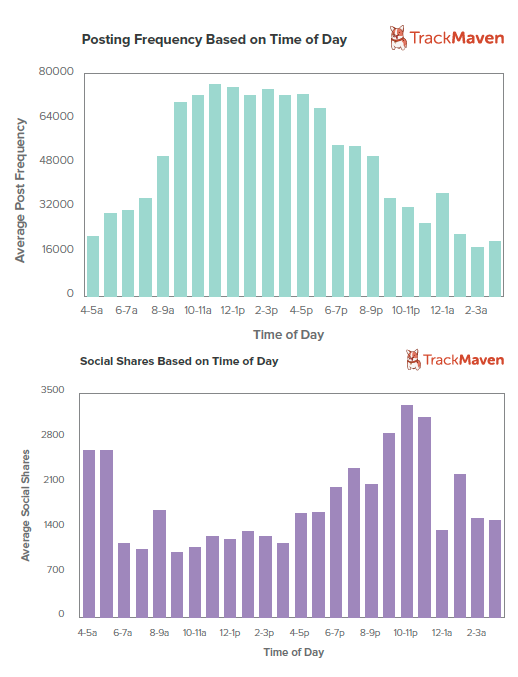
Posts that are published between 9pm and midnight EST receive the most social shares. If increasing engagement is one of your goals, it’s time to try publishing outside of regular business hours. I know I am going to test the time of day data with Imagine’s content.
Titles
While I was primarily searching for data regarding timing and scheduling of posts, the TrackMaven report also included information about titles. There are countless articles out there about how to create an effective title for blog posts, emails, ppc ads, etc. This research focused on the number of characters and a few word choices.
When writing titles, 60 characters seems to be the sweet spot. Of the posts analyzed, most titles were around 40 characters. However, posts with titles containing 60 characters had more social shares. See the graph below.
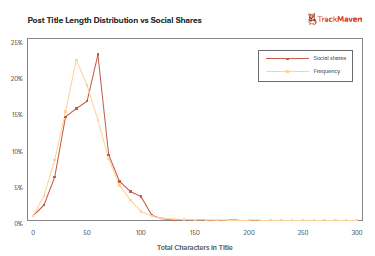
Be careful not to go beyond 60. Social shares dropped off sharply when the titles got longer.
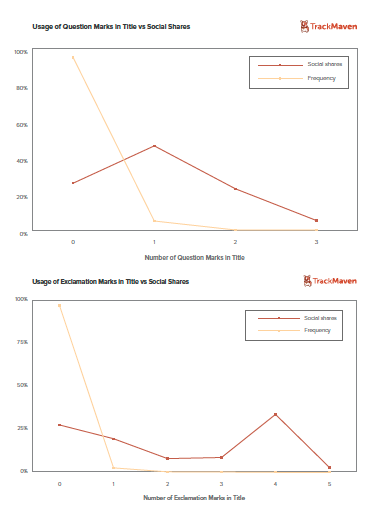
Punctuation used in titles was also analyzed. Question marks seem to drive social shares. Only 5% of the posts analyzed contained question marks in their titles but 46.3% of those received social shares. That is almost double the social shares of titles without question marks. According to the data, more is not better. Titles with two or more question marks received the lowest level of engagement.
Exclamation points were also analyzed. Less than 3% of the blog titles analyzed contained exclamation points. Social shares dropped for those containing 1-3 points. One interesting point did emerge. While only 0.1% contained 4 exclamation points, those posts had more social shares. See the graphs below.
Starting today, I’ll be paying closer attention to the number of characters in our blog titles and will also test using questions.
The full report contains more information and further analysis. My main takeaway from this data is that it is important to keep testing. There’s nothing more frustrating than creating really good content that gets little engagement. Poor results send you back to the drawing board and may cause you to second guess yourself.
Before you change too much of your approach, try changing the easy things. Changing the days of the week or even the times you publish may not change your results…but you won’t know for sure until you try. Who knows, it may make all the difference.